Introducing GoCanvas Analytics – Turn Your Data Into Actionable Insights
Meet GoCanvas Analytics
Many businesses struggle to keep up with their paperwork and miss out on opportunities to better collect and share information from their forms and processes. GoCanvas helps companies ditch the paperwork and capture operational data with mobile devices to improve efficiency. In addition to helping organizations capture more valuable information–including pictures, GPS locations, conditional data, and automatic calculations–we also help companies do more with this data through workflows, dispatching, and sharing with customers and colleagues.
How GoCanvas Analytics Can Help
Our customers create millions of submissions (and many millions of more data points) with GoCanvas every month to power their businesses across a variety of industries.
But what happens when you have all of this data and are looking for insights? Gleaning insights from submission data have historically been a bit of a chore–requiring customers to either manually download this data into a spreadsheet or build out an integration with another reporting system.
Naturally, our customers have been asking us to deliver built-in reporting capabilities.
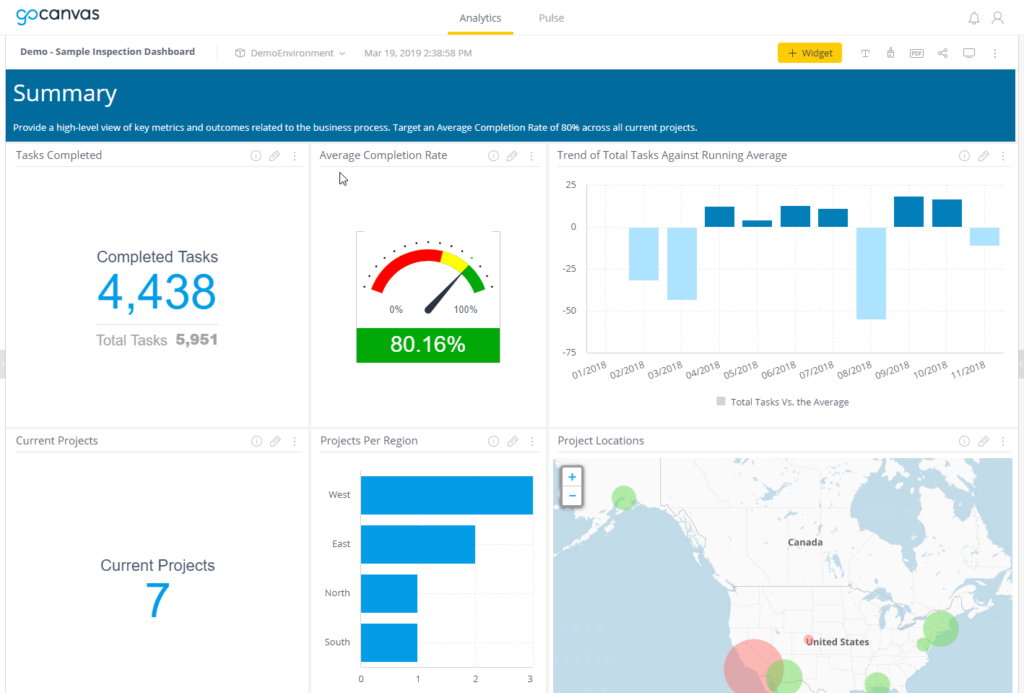
We’ve listened to our customers and are pleased to announce GoCanvas Analytics: a powerful solution that enables you to convert your submission data into interactive dashboards. Visualize key data in real-time and gain insights to help your business perform even better.
Putting the Data in Your Hands
GoCanvas Analytics puts the data in your hands, allowing you to uncover deeper insights and make more informed decisions with greater impacts on your success. With our reporting suite, you’ll be able to build and share at-a-glance dashboards and visualizations using your GoCanvas submission data to:
- Spot trends and anomalies in your core lines of business
- Drill into key data points to get a better understanding of what’s happening with your business
- Make data-driven decisions to cut down on things that are not working and double down on those things that are working well
- Share dashboards with team members across your company to keep people informed
- Create alerts to proactively notify you when anomalies arise
Our goal is to make this accessible to anyone on your team who needs it, so everyone can see what’s happening and make the changes necessary to improve your business.
Get Started with GoCanvas
Sign up to learn more about GoCanvas Analytics or contact your Account Manager today to learn more. We have already started to roll out our reporting platform to customers, and we are excited to hear how you can use this to help drive your business forward.

Stay in Touch!
About GoCanvas
GoCanvas® is on a mission to simplify inspections and maximize compliance. Our intuitive platform takes care of the administrative tasks, freeing our customers to focus on what truly matters – safeguarding their people, protecting their equipment, and delivering exceptional quality to their customers.
Since 2008, thousands of companies have chosen GoCanvas as their go-to partner for seamless field operations.
Check out even more resources

Gown Your Business with GoCanvas Partner Program
Join our Partner Program and gain instant access to our global network of thought leaders and industry experts enjoying shared collaboration and collective success.
Partner Snapshot: Forte Supply Chain Solutions
Explore how Forte Supply Chain Solutions partnered with GoCanvas, combining in-house industry expertise with our white-label mobile forms to revolutionize their processes.

GoCanvas Integrations: Streamline your Workflow
Integrate with over 1,000 software applications. Enhance your GoCanvas experience by syncing real-time data to one or all of your business tools.